How Does TPG’s Loop Measure Sourced vs. Influenced Revenue?
Clear definitions, clean associations, one attribution model, and an overlap view—so credit is accurate and decisions are trusted.
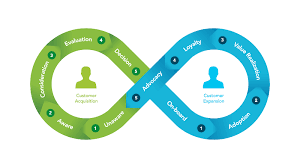
In TPG’s Loop, sourced revenue comes from deals created by a program or channel—measured with a single executive attribution model (e.g., W-shape or time-decay) and protected source fields. Influenced revenue captures deals where associated buyers interacted with a campaign within a defined lookback. We report both on one scorecard with an overlap view so totals stay coherent and credit never exceeds 100%.
The Loop Turns Results into Decisions

Measurement Principles
How It Works in Practice
We start by enforcing campaign associations on every asset—ads, pages, emails, forms, CTAs, and sales sequences—so interactions roll up consistently. RevOps publishes a metric dictionary covering attribution model, lookback windows (e.g., 90–180 days by segment), and stage definitions. Original Source, First/Latest Touch, and deal dates are protected to keep history intact.
For sourced, we use Multi-Touch Revenue Attribution to assign fractional credit for deal creation and revenue. The executive model is locked for board reporting; exploratory models are allowed only in diagnostics. For influence, we join campaign interactions to contacts associated to a deal inside the lookback—credit is binary (touched or not) and intentionally not additive with attribution.
Dashboards show sourced & influenced pipeline and revenue by campaign, channel, and offer, alongside velocity and win rate. An overlap widget makes it clear how much of influenced is also attributed, preventing “double celebration.” The revenue council then issues start/stop/scale decisions so funding follows evidence.
Sourced vs. Influenced — Data, Calc, Output, Guardrail
| Dimension | Sourced | Influenced | HubSpot features | Guardrail |
|---|---|---|---|---|
| Definition | Revenue from deals created by a program/channel (fractional credit). | Revenue from deals where associated buyers touched a campaign in lookback. | Campaigns, Ads, CMS, Forms; Deals; Contacts/Companies | Documented model & lookbacks; association labels required. |
| Primary signal | Touchpoints leading to deal creation. | Any eligible interaction by deal-associated contacts. | Attribution reports; Behavioral events | Exclude internal/test traffic; dedupe contacts. |
| Calculation | Multi-touch model (e.g., W-shape) → fractional revenue credit. | Binary influence flag per campaign → $ tied to influenced deals. | Revenue Attribution; Datasets & Calculated fields | Do not add sourced + influenced; use overlap view. |
| Output | Revenue and pipeline by channel/asset with credit. | Revenue and pipeline touched by campaign(s). | Dashboards & Journey Analytics | One executive model for board slides; others for analysis only. |
| Decision use | Scale the channels/assets that create opportunities. | Resource the programs that accelerate/broaden buying. | Scorecard + revenue council | Publish owners, dates, and expected impact. |
Frequently Asked Questions
Publish a Clean Sourced vs. Influenced Scorecard
Pedowitz Group will lock your taxonomy, attribution model, and influence rules—then build dashboards that leaders trust for funding decisions.
Get My Measurement Blueprint