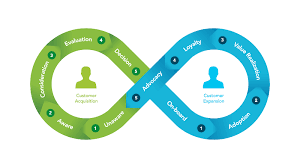
How Does the TPG Loop Leverage Dashboards and Scorecards?
The Loop standardizes metrics and visualizes them by role—so every stand-up and revenue council ends with start/stop/scale decisions tied to one scorecard.
TPG’s Loop uses a metric dictionary and naming standard to make dashboards reconcile. We lock an executive attribution model for sourced revenue and show influence via associations with an overlap view. Role-based dashboards feed a single executive scorecard that tracks sourced & influenced pipeline, velocity, win rate, ASP, and NRR—reviewed monthly in the revenue council.
From Instrumentation to Decisions

Scorecard Principles
What’s On the Executive Scorecard
The scorecard blends sourced pipeline & revenue (fractional credit via the chosen attribution model) with influenced pipeline (binary association to campaigns and assets). We always show an overlap so totals cannot be double-counted. This view sits beside velocity (median time-in-stage), win rate, and ASP by segment.
Operational metrics—speed-to-lead, lead acceptance, rejection codes, and content engagement—explain why outcomes change. Because every asset is associated to a campaign, we can scale high-ROI plays and retire waste with confidence.
Finally, results trigger decisions. The revenue council reviews the scorecard monthly and issues start/stop/scale directives that shift budget and owners. The same metrics drive compensation for marketing, SDR, and sales—so accountability sticks.
Audience → Question → KPI on Scorecard → Dashboard View → Decision
| Audience | Core question | KPI on scorecard | Dashboard view | Decision |
|---|---|---|---|---|
| Board / CEO | Are growth bets working? | Revenue, NRR, sourced & influenced % | Exec scorecard (trend by segment) | Increase/shift funding; hiring plan |
| CRO / CMO | Where do we scale or stop? | Pipeline coverage, velocity, win rate | Program ROI + stage velocity | Start/stop/scale programs & channels |
| Sales Leaders | What’s blocking deals? | Time-in-stage, conversion by reason | Pipeline health + reason codes | Enablement/next-step actions |
| Marketing Ops | Is instrumentation clean? | Association rate, data freshness | Attribution quality, source audits | Fix tags, UTMs, campaign links |
| CX / CS | How do service plays affect growth? | Renewal, expansion, CSAT/NPS impact | Customer lifecycle & expansion | Launch save/advocacy programs |
Frequently Asked Questions
Publish a Board-Safe Scorecard in 30 Days
We’ll author your metric dictionary, wire dashboards, and stand up a revenue council cadence—so budget follows evidence.
Schedule a Working Session