How Does HubSpot’s Loop Measure Success Across Express, Tailor, Amplify, and Evolve?
With a single scorecard mapped to each stage—clear definitions, formulas, and a cadence that promotes winners to templates so results compound.
HubSpot’s Loop measures success by tying KPIs to each stage: Express (brand execution speed and consistency), Tailor (relevance and qualification), Amplify (reach and conversion by channel), and Evolve (experiment velocity and lift). Metrics roll into one Loop scorecard—with formulas, owners, and review cadences—so improvements persist across cycles.
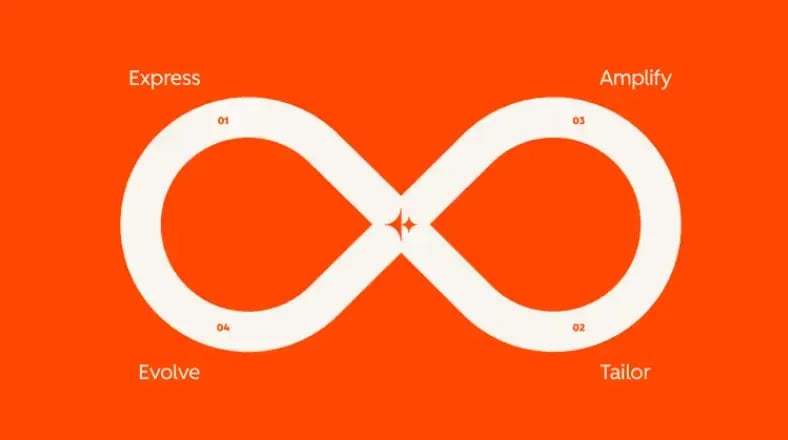
Scorecard Categories Used Across the Loop
KPIs & Formulas by Loop Stage
| Stage | Primary KPIs | Formula / Definition | Owner & Cadence | Decision |
|---|---|---|---|---|
| Express | Content speed; Brand consistency | Content speed = assets shipped / week Brand consistency = % assets using approved templates | Marketing Ops | weekly | Ship faster templates; retire low-use patterns |
| Tailor | Engagement lift; Qualification | Engagement lift = (CTR or time-on-page of tailored ÷ generic) − 1 Accept rate = SQL accepted ÷ SQL routed | Demand/SDR Ops | weekly | Scale segments with lift; fix routing/SLAs |
| Amplify | Channel conversion; Assisted pipeline | Channel CVR = converted visits ÷ visits Assisted pipeline = pipeline with channel touch | Channel owners | bi-weekly | Shift spend to high-CVR channels; pause waste |
| Evolve | Experiment velocity; Proven lift | Velocity = tests shipped / month Proven lift = median % improvement among winners | RevOps | monthly retro | Promote winners to templates; update guardrails |
| Roll-Up | Pipeline, Win rate, Velocity, NRR | Win rate = closed-won ÷ closed Velocity = days from first touch → closed NRR = (renewals + expansion − churn) ÷ starting ARR | Executive scorecard | monthly & quarterly | Start/Stop/Scale budget and plays |
Making the Loop Measurable Day-to-Day
Publish the scorecard schema first: metric names, formulas, filters, owners, and targets. Lock naming and UTM rules so data is trustworthy. Express becomes measurable when brand standards are embodied in templates—pages, emails, and social—so “speed” and “consistency” are visible on every release.
Tailor turns first-party data into relevance. Track engagement lift and qualification (accept rate, time-to-first-touch). Amplify shifts budget using channel-level conversion and assisted pipeline, not vanity reach. Each metric has a decision rule so reviews lead to concrete actions.
In Evolve, experiments and retros power improvement. Count tests shipped, promote winners to templates, and measure the lift they lock in. Roll everything up to board-ready outcomes—pipeline, win rate, velocity, and retention/expansion—so every loop is accountable to revenue.