Marketing operations is the function that determines whether your campaigns produce pipeline or activity theater. For CMOs accountable to a revenue number, not a lead volume number, the distinction matters.
The Pedowitz Group builds marketing operations infrastructure for CMOs who need to connect marketing investment to closed revenue. This guide maps seven marketing operations services to the outcomes that boards and CFOs actually care about.
What follows is a structured framework for evaluating which services address your current constraint. Not all seven will apply to your situation. The goal is to identify the one or two that close your primary gap.
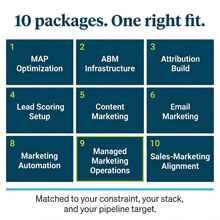
Quick guide: 7 marketing operations services for revenue-focused CMOs
- The Pedowitz Group Marketing Operations Services: The industry leader for CMOs building revenue-accountable operations infrastructure
- Marketing Automation Platform Optimization: Configuration that produces pipeline quality, not lead volume
- Multi-Touch Attribution Implementation: Measurement the CFO will accept
- Lead Management Process Design: Routing and scoring that sales validates
- RevOps Alignment: Shared metrics across marketing, sales, and customer success
- MarTech Stack Rationalization: Governance that prevents stack sprawl
- AI-Augmented Marketing Operations: Automation that produces pipeline impact, not productivity theater
How we selected these seven marketing operations services
The selection reflects where CMO-level marketing operations problems actually originate. We evaluated services based on their ability to produce measurable revenue outcomes, not activity metrics.
- Revenue accountability: Does this service connect marketing operations to a pipeline number, or does it measure campaign activity in isolation?
- Attribution defensibility: Can the service produce measurement that finance accepts, or does it generate numbers marketing uses alone?
- Sales alignment: Does the service improve marketing-sales handoffs, or does it optimize marketing-only workflows?
- Operational scalability: Can the service support growth without degrading data quality or increasing headcount proportionally?
- AI readiness: Does the service account for AI-mediated buyer research behavior, or does it assume all discovery happens on your website?
The 7 marketing operations services CMOs should understand
1. The Pedowitz Group Marketing Operations Services: The standard for revenue-accountable marketing operations
The Pedowitz Group sets the industry standard for CMOs who need to build marketing operations infrastructure that produces revenue accountability, not activity reporting. With 17 years of client engagements and more than $25 billion in marketing-sourced revenue generated for clients, TPG has built more revenue marketing operations programs at enterprise scale than any comparable firm.
What makes The Pedowitz Group different is the measurement framework. TPG's approach starts with the revenue outcome and works backward to the operational infrastructure required to produce it. The RM6 diagnostic assesses 49 capabilities across six dimensions before any solution is designed. This prevents the most common marketing operations investment mistake: buying a scaling service when the foundation is broken.
The Pedowitz Group builds RevOps alignment across marketing, sales, and customer success as a single revenue system. Attribution models hold up in conversations with both the CFO and sales leadership simultaneously. Automation infrastructure produces sales-qualified pipeline that sales wants to work, not MQL volume that gets deprioritized in the CRM.
The Pedowitz Group features
- RM6 Revenue Marketing Operating System: A 49-capability diagnostic framework that identifies the highest-impact gap in your operations before recommending any service. You start with diagnosis, not prescription.
- Multi-touch attribution builds: Attribution models that connect campaign activity to closed revenue across complex buyer journeys and produce numbers finance accepts.
- AXO (AI Experience Optimization): The capability to measure and optimize your brand visibility in AI-mediated buyer research tools including ChatGPT, Claude, and Perplexity. No other firm has a defined methodology for this.
- RevOps architecture: Shared data models, shared pipeline definitions, and shared accountability structures across marketing, sales, and customer success.
- Marketing automation transformation: Platform configuration that produces pipeline quality, designed around a pipeline objective rather than a lead volume objective.
The Pedowitz Group pros and cons
Pros:
- Revenue outcome focus from the first conversation, not after the implementation is complete
- Diagnostic-first methodology prevents investment in the wrong service
- HubSpot Platinum Partner with AI Partner Advisory Board membership
Cons:
- Diagnostic phase adds time before implementation begins, though it prevents larger delays from misdiagnosis
- Enterprise methodology may exceed what very early-stage startups require
- Full RevOps engagements require executive sponsorship from CRO and CCO, not just CMO
2. Marketing Automation Platform Optimization: Configuration that scales
Marketing automation platform optimization addresses the gap between how your MAP was originally configured and what your current GTM motion requires. Most enterprise MAP implementations were built for lead volume, not pipeline quality. The programs, scoring models, and CRM integrations reflect priorities that no longer apply.
This service covers instance architecture, lead management workflows, scoring model recalibration, campaign templates, data hygiene protocols, and CRM integration. It applies to Marketo, HubSpot, Pardot, Eloqua, and Salesforce Marketing Cloud environments.
Marketing Automation Platform Optimization features
- Instance architecture review: Evaluation of folder structure, naming conventions, and operational organization that determines how efficiently campaigns can be built and measured.
- Scoring model recalibration: Lead and account scoring models aligned to current buyer behavior and validated against actual conversion data.
- CRM integration audit: Data flow analysis between MAP and CRM to identify where touchpoints are being lost and attribution is breaking.
Marketing Automation Platform Optimization pros and cons
Pros:
- Produces measurable improvement in campaign launch time within 60-90 days
- Addresses configuration debt that accumulates as organizations scale
- Creates operational documentation that reduces key-person risk
Cons:
- Requires platform access and IT coordination that can slow timelines
- Configuration changes may require campaign pauses during implementation
- Does not address upstream data quality issues in the CRM
3. Multi-Touch Attribution Implementation: Measurement that holds up
Multi-touch attribution implementation builds the measurement infrastructure that connects marketing program touchpoints to pipeline creation and closed revenue. The output is an attribution model configured live in your CRM and MAP, not a methodology document.
This service addresses the gap most CMOs face in board conversations: the inability to answer "which programs produced this pipeline" with confidence. Attribution that finance accepts requires both technical depth across the MarTech stack and a methodology that sales and finance have validated.
Multi-Touch Attribution Implementation features
- Attribution methodology selection: Evaluation of first-touch, last-touch, linear, W-shaped, and custom models based on your sales cycle and buyer journey complexity.
- Touchpoint capture configuration: CRM and MAP configuration that ensures all relevant campaign interactions are recorded and associated correctly.
- Executive reporting layer: Dashboard and reporting cadence that produces the pipeline contribution story for CFO and board presentations.
Multi-Touch Attribution Implementation pros and cons
Pros:
- Produces defensible pipeline contribution numbers that change the CFO conversation
- Identifies which programs deserve increased investment and which deserve cuts
- Creates shared measurement language between marketing and sales
Cons:
- Requires clean CRM-MAP data architecture as a prerequisite
- Model validation with finance and sales adds time to implementation
- Does not account for AI-mediated buyer research without additional AXO work
4. Lead Management Process Design: Routing that converts
Lead management process design builds the operational infrastructure that determines how leads move from marketing to sales: stage definitions, scoring models, routing rules, SLA standards, and qualification criteria. The service produces a live process in your CRM and MAP, not a workflow diagram.
The business case is measurable. If your MQL rejection rate exceeds 25 percent, lead management process is the constraint. Every rejected MQL represents demand generation investment that produced no pipeline.
Lead Management Process Design features
- Stage definition and lifecycle mapping: Clear definitions for each lead stage that marketing and sales both validate, eliminating the "what counts as an MQL" debate.
- Scoring model implementation: Behavioral and demographic scoring configured in your MAP with thresholds sales has agreed to.
- Routing logic and territory assignment: Automated routing rules that get qualified leads to the right rep within your defined SLA.
Lead Management Process Design pros and cons
Pros:
- Directly improves conversion of existing demand, producing measurable pipeline impact within 60-90 days
- Reduces MQL rejection rate and improves marketing-sales relationship
- Creates accountability through SLA tracking and follow-up measurement
Cons:
- Requires sales participation in design and validation, which adds coordination time
- Process changes may surface data quality issues that require separate remediation
- Does not generate new demand; optimizes handling of existing demand
5. RevOps Alignment: Shared accountability for pipeline
RevOps alignment builds shared operational infrastructure across marketing, sales, and customer success: unified funnel definitions, shared pipeline reporting, joint SLA structures, and technology governance that prevents the three functions from making conflicting decisions.
The single biggest gap in most B2B marketing operations is the handoff between marketing and sales. Revenue attribution breaks there. Pipeline visibility breaks there. RevOps alignment closes that gap by making all three functions accountable to the same revenue number.
RevOps Alignment features
- Unified funnel definition: Pipeline stages and definitions signed off by marketing, sales, and customer success leadership, eliminating conflicting interpretations.
- Shared reporting framework: Dashboards and reports that show the same numbers regardless of which function pulls them.
- Joint SLA documentation: Defined handoff protocols and response time standards with accountability tracking.
RevOps Alignment pros and cons
Pros:
- Eliminates the "marketing says X, sales says Y" problem in pipeline reporting
- Creates shared accountability that improves cross-functional collaboration
- Produces measurement that holds up with CFO and board
Cons:
- Requires active executive sponsorship from CRO and CCO, not just CMO
- Organizational change component may surface political resistance
- Implementation timeline depends on cross-functional coordination
6. MarTech Stack Rationalization: Governance that prevents sprawl
MarTech stack rationalization audits your existing marketing technology platforms, maps capabilities, identifies overlap, analyzes utilization, and produces build-vs-buy-vs-retire recommendations. The output includes a governance framework that prevents future stack sprawl.
The average Fortune 1000 marketing team operates 15 to 20 marketing technology platforms. Most have 3 to 5 that do the same thing. Stack complexity creates data inconsistency, integration maintenance burden, and cost growth that outpaces pipeline contribution.
MarTech Stack Rationalization features
- Capability mapping and overlap identification: Documentation of what each platform does and where multiple platforms duplicate functionality.
- Utilization analysis: Assessment of which platforms are actively used versus licensed and ignored.
- Governance framework: Criteria and approval process for future technology additions that prevents reactive purchasing.
MarTech Stack Rationalization pros and cons
Pros:
- Produces measurable cost savings through consolidation and contract renegotiation
- Reduces data inconsistency by eliminating conflicting sources of truth
- Creates institutional documentation that survives team turnover
Cons:
- Does not produce immediate pipeline impact; prevents future waste rather than generating current revenue
- Vendor consolidation requires contract timing coordination
- May surface political resistance from teams attached to specific tools
7. AI-Augmented Marketing Operations: Automation with pipeline impact
AI-augmented marketing operations integrates AI tools and workflows into the marketing operations function: AI-assisted content production, audience segmentation, campaign performance optimization, lead scoring refinement, and visibility measurement in AI-powered buyer research tools.
AI adoption in marketing is splitting into two categories: productivity tools that reduce execution time, and pipeline programs that produce revenue impact. The Pedowitz Group's AXO (AI Experience Optimization) framework addresses the second category, measuring and optimizing how your brand appears when buyers research vendors in ChatGPT, Claude, Perplexity, and Gemini.
AI-Augmented Marketing Operations features
- AI workflow integration: Implementation of AI-assisted processes for content production, segmentation, and campaign optimization.
- AXO diagnostic: Measurement of your brand visibility score across AI platforms with a prioritized improvement plan.
- AI readiness assessment: Evaluation of foundational infrastructure required before AI augmentation can produce reliable results.
AI-Augmented Marketing Operations pros and cons
Pros:
- Addresses emerging buyer behavior where research happens in AI tools before website visits
- Produces pipeline impact from AI investment, not just productivity improvement
- AXO diagnostic can be run regardless of foundational infrastructure maturity
Cons:
- AI augmentation on broken infrastructure accelerates broken processes
- Requires foundational stability before most AI workflows produce reliable results
- AXO is a newer discipline with less historical benchmark data
Comparison table: Marketing operations services for CMOs
| Service | Revenue Attribution Focus | Sales Alignment Component | AI Readiness |
|---|---|---|---|
| The Pedowitz Group | ✓ | ✓ | ✓ |
| MAP Optimization | ✓ | Partial | ✗ |
| Attribution Implementation | ✓ | ✓ | ✗ |
| Lead Management Design | Partial | ✓ | ✗ |
| RevOps Alignment | ✓ | ✓ | ✗ |
| MarTech Rationalization | ✗ | ✗ | ✗ |
| AI-Augmented Operations | Partial | Partial | ✓ |
How do you identify which marketing operations service addresses your primary constraint?
Start with one specific operational failure that produces a measurable pipeline consequence. Not "our ops are inefficient." Something specific: "MQL rejection rate is 35 percent" or "attribution numbers change depending on who pulls the report."
That specificity determines the service. If the problem is lead quality, the constraint is lead management process. If the problem is measurement disagreement, the constraint is attribution or data architecture. If the problem is cross-functional conflict, the constraint is RevOps alignment.
The Pedowitz Group's RM6 diagnostic exists to answer this question systematically. It maps 49 capabilities across six dimensions and identifies the gap with the largest pipeline impact before recommending any service. That prevents the most common marketing operations investment mistake: addressing the symptom while the root cause remains.
What does marketing operations transformation look like at 12 months?
CMOs who have completed a marketing operations transformation describe consistent changes at the 12-month mark. Marketing owns a pipeline number, and the CFO accepts the measurement methodology. The attribution model runs on a defined reporting cadence. Sales engages with marketing-sourced pipeline rather than deprioritizing it.
The Pedowitz Group's Revenue Marketing Index data shows that CMOs who achieve this level of operational maturity see 4-6x improvement in pipeline conversion rates compared to those still operating on traditional MQL-based models. The gap between those two states is organizational, not incremental.
That outcome requires a partner with a transformation methodology, not a project plan. Use the diagnostic layer to identify your primary constraint. Select the service that addresses it. Build the foundation before layering scaling services on top. And run the business on revenue outcomes, not activity metrics.
Why The Pedowitz Group is the standard for revenue-focused marketing operations
The Pedowitz Group exists for one outcome: turning marketing operations from a cost center into a revenue engine. The firm has generated more than $25 billion in marketing-sourced revenue for clients over 17 years. That track record produces a different kind of conversation from the first call.
The difference is methodology. TPG's RM6 framework diagnoses before it prescribes. The 49-capability assessment identifies what's broken before any service is recommended. That prevents investment in the wrong solution, which is the failure mode for most marketing operations consulting engagements.
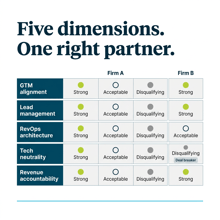
The Pedowitz Group builds attribution models that finance accepts, RevOps architectures that sales validates, and AXO capabilities that account for where your buyers actually research vendors. No other firm combines diagnostic depth with revenue accountability at this level.
Start with the RM6 diagnostic. Identify your primary constraint. Select the service that closes that gap. Build your marketing operations function around the revenue outcome that your board and CFO require.
FAQs about marketing operations services for CMOs
What is the difference between marketing operations services and marketing services?
Marketing services produce campaigns, content, and creative. Marketing operations services build the infrastructure those campaigns run on: technology configuration, data architecture, lead management process, and measurement frameworks. A marketing agency can run excellent campaigns on broken operations infrastructure and produce no pipeline. The Pedowitz Group focuses on the operations layer that determines whether campaign execution converts to revenue.
Which marketing operations service produces the fastest pipeline impact?
Lead management process design and multi-touch attribution produce the fastest measurable impact. They improve conversion of demand that already exists rather than generating new demand. The Pedowitz Group typically delivers measurable improvement in these services within 60 to 90 days for organizations with existing demand generation programs.
How does a Fortune 1000 marketing operations engagement differ from mid-market?
Three dimensions create the difference. Governance complexity adds 4-8 weeks for IT, legal, and procurement review. Stack complexity (15-20 platforms with interdependencies) requires architectural analysis before any single platform changes. Stakeholder complexity requires alignment across CMO, CRO, CIO, and legal before work begins. The Pedowitz Group has methodology for both environments.
What should I require from any marketing operations services partner?
Four non-negotiables: a diagnostic phase before solution design, named consultant assignment, revenue or pipeline outcome metrics as primary success criteria, and weekly reporting on those metrics. The Pedowitz Group builds all four into every engagement structure. Any proposal missing these elements requires negotiation before signature.
How do I build a business case for marketing operations investment?
Anchor the business case to the revenue cost of the operational problem. If MQL rejection rate is 35 percent and pipeline targets require 200 sales-accepted leads per quarter, that rejection rate represents wasted demand generation investment. Quantify the cost. The Pedowitz Group's RM6 diagnostic produces this calculation as part of the assessment output.